Preface
Data wrangling is the process of cleaning and unifying messy and complex data sets for easy access and analysis. The readers of this article can expect to have a decent level of understanding of the meaning of Data Wrangling, its underlying phenomena, and processes. The article will cover broader topics like what data wrangling is all about, its associated processes, its importance in the field of data science, and essential tools involved in data wrangling, among other things.
Introduction
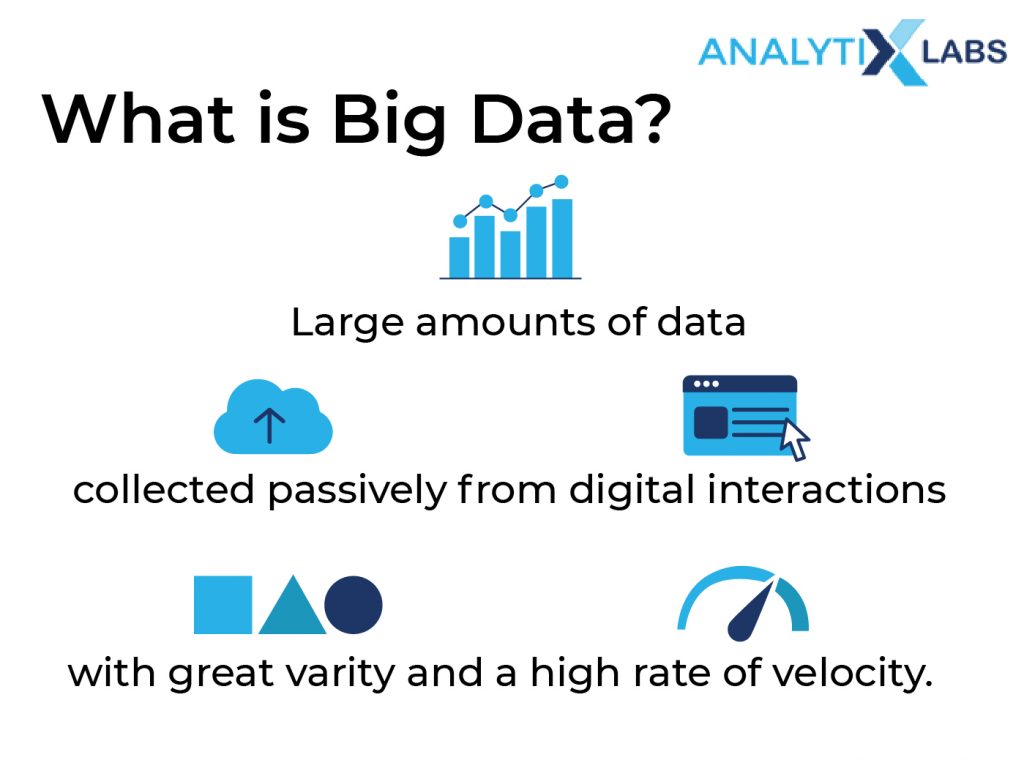
- Grounds for the birth of Big Data
We may not have realized it, but a revolution has taken place in the last few years. This time the revolution has not taken place in the political or industrial sphere, but it has taken place in the realm of information technology. The internet has become fast and ubiquitous. The computer hardware capability increased multifold so much that now we have large enough memory, GPU, and fast enough processors to perform highly complicated tasks.
As we all realize that the reliance on computers, smartphones, and other similar machines to perform routine tasks through the Internet has led to the Internet of Things (IoT). All these circumstances created a perfect ground that showed the world and, specifically, the tech industry, the concept of Big Data.
- The 4 Vs
The first thing to understand is that big data doesn’t simply refer to a dataset lying somewhere that takes up a lot of space. Big Data is, instead, a phenomenon. The phenomenon of Big Data is fuelled by, as IBM researchers put it: the 4Vs. These 4 Vs are Volume, Variety, Velocity, and Veracity, and are also referred to as characteristics of Big Data.
We often refer to Volume as Big Data, i.e., data occupying a massive space on a drive. Variety refers to how data manifests itself, i.e., the table in your spreadsheet is as equal a data as a CCTV footage of a traffic stop. Every individual, organization, system, etc., produce data at every second of its existence, which increases the pace of data generation, i.e., Velocity.
Lastly, for a data scientist, the question is always regarding how useful, valuable, and trustworthy the information is. This leads to the concept of data Veracity.
- Impact of Big Data
Big Data’s significant change is that now researchers, analysts, and data scientists can see patterns, predict values, and analyze the world around them. It was previously impossible. This is due to the sheer amount of data that we have.
For example, we can take a person’s demographic and transaction information on various platforms, information gathered through publicly available reviews, comments, etc. This can give us a complete understanding of that person. We can do this for millions of records that help us create unheard-of products.
Let’s pick any of the domains that make Big Data, such as Social Media, Hospitality, Banking, Finance, etc. For example, if we consider Stock Prediction using Big Data Machine Learning, the predictive model used in the Medallion hedge fund of Renaissance Technologies uses historical data and inputs from so many places that creating a predictive model would not have been possible in the ’90s.
Thus, while the scope of Big Data is immense, so are the challenges a user or an organization faces before they can leverage big data for their benefit.
AnalytixLabs is the premier Data Analytics Institute specializing in training individuals and corporates to gain industry-relevant knowledge of Data Science and its related aspects. It is led by a faculty of McKinsey, IIT, IIM, and FMS alumni who have outstanding practical expertise. Being in the education sector for a long enough time and having a wide client base, AnalytixLabs helps young aspirants greatly to have a career in Data Science.
1. What Is Data Wrangling?

The answer to the question “What is data wrangling” connects to big data, and there is a reason why Big Data and Data wrangling go hand in hand. The use of big data allows us to find unique insights. But the problem is that now as the data is being generated from various sources in all shapes and forms, we can’t use it as it is. This is where the need for Data Wrangling comes into play.
The meaning of data wrangling is the process of taking data that is often unstructured, raw, disorganized, messy, complicated, incomplete, etc., and making it more usable and structured. This “proper” or wrangled data can be used for further consumption in the typical analytical and modeling processes.
Thus, once data wrangling is done, other processes will begin. Like data mining (which includes exploratory data analysis, visualization, and descriptive statistics), bivariate statistical analysis, statistical or machine learning modeling, etc. Identifying the gaps in a dataset, removing outliers, and merging various data sources into one, are some of the data wrangling examples.
2. Steps in Data Wrangling Process
Data Wrangling remains a largely manual task that users must perform before using the data. There is a broad consensus regarding the number of steps to perform in a chronology to complete a Data Wrangling process. Following are the common Data Wrangling steps:
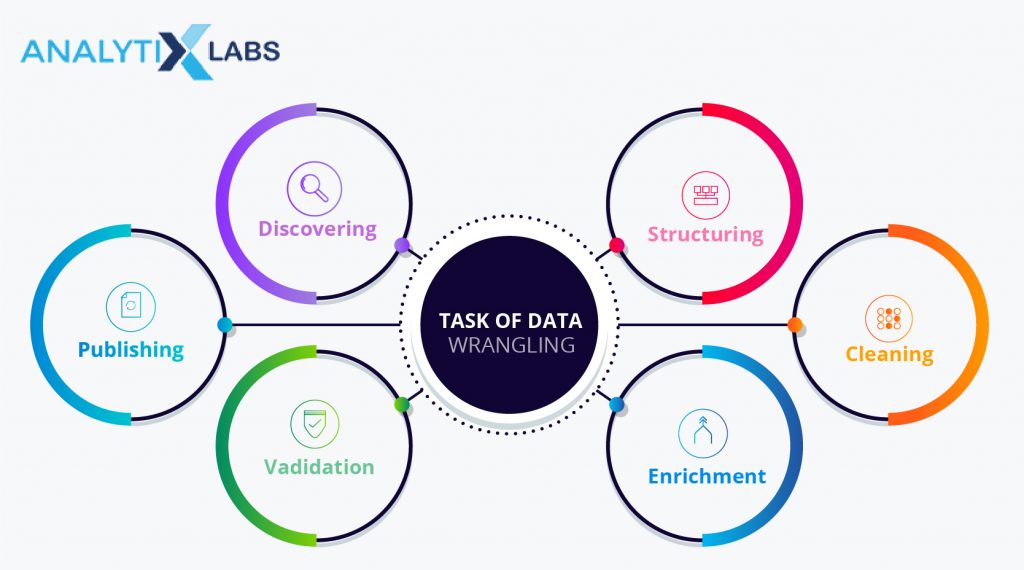
- Data Identification
The first step in the process of Data wrangling is the identification of the sources from which the relevant data can be obtained. Data acquisition in machine learning is a foremost and fundamental step. The data can be present in remote servers or may be available on the internet that can be used through web scrapping.
The data may be accessible through some other platform for which access rights might be required, which the client/administrator can provide. Several Big Data concepts, such as HDFS, Spark, etc., come in in this step. They are used to access large amounts of data from an organization’s database.
- Data Understanding
This step is critical to properly performing the remaining steps of Data Wrangling. The user needs to have some essential to intermediate level of understanding regarding the data or datasets they will be using ahead. This can include
– identification of the crucial variables and what part of the business they represent
– understanding statistical properties such as mean, median, mode, the variance of a numerical, and count of the distinct categories of the categorical variable
– Identification of the ID variables that can eventually help in combining datasets
– Recognizing the plausible dependent variable
– Identification of the independent variables and also identifying if there are derived, protected, etc. types among them
- Structuring Data
As mentioned earlier, often, big data is in an unstructured format, and we require the data to be in a structured format so that we can exploit it for our use cases. A quintessential example of this would be when performing Text Mining. Text can be a valuable data source. However, it is unstructured, and we need to create structures such as Document Term Matrix to make it in a structured format. Similar things are to be done with other unstructured datasets such as audio, images, video, HTML, XML, JSON, etc.
Another subprocess could be joining structured datasets to get a combined dataset that can then be used. To join using a one-to-one relationship, the user has to aggregate the data so that merging results are coherent to perform predictive modeling.
- Data Cleaning
The data goes under many content-based manipulations in the process of Data Cleaning. This helps in reducing the noise and unnecessary signals in the data. Here are the following processes as part of data cleaning.
– Missing Value Treatment: Remove missing values by removing rows or columns with excessive missing values. Imputation methods such as mean, median, or mode value imputation can also be performed based on the data type and distribution of the variable.
– Outlier Treatment: Outliers can be understood as abnormally large and small values. They are particularly harmful when performing bivariate statistical tests or statistical modeling. The outliers can be capped to a value that, while preserving the distribution of the data, removes the adverse impact of the outliers.
The main problem here is the identification of an appropriate upper-cap(UC) and lower-cap(LC) value. It is difficult to ascertain the best value for capping a particular variable. But methods such as percentile analysis, IQR, percentile 1(LC), and percentile 99(UC) can provide a decent value.
– Feature Reduction
Certain redundant variables with no statistical and aggregation properties and making little sense from an analytical point of view can be removed.
- Data Enriching
Once the data is clean, the user can look for ways to add value to the data. This can be achieved by deriving more variables using the existing feature set. For example, a variable having phone numbers might be useless data as it has extreme cardinality and no statistical properties. But can be used to identify the residence location of the customers.
Similarly, the user in this step looks for other information that may not be present in the data. Though the information might not be readily available, we can add it to the data to enrich it further. For example, adding a variable with the crime rate in an area, so someone is creating a model that approves insurance claims, the information can be useful.
- Data Validation
The second last step of the data wrangling process is ensuring that the data quality is not compromised by following all the steps until now. By validation, we mean having consistent and accurate data. Data validation is typically done by laying down a bunch of rules and checking if the dataset is fulfilling those criteria or not. The rules for a dataset can be based on the variables’ data type, expected value, and cardinality.
For example, in the dataset, a variable Age with a numerical data type with a range between 1 and 110, a high level of cardinality, no missing value, no value in 0 or negative, etc, is useful. Thus, similar rules are made, and the dataset can be cross-checked against them. Programs can often be written to validate if the dataset follows the prescribed rules.
- Data Publishing
Eventually, once all the above steps are taken care of and the data is structured, cleaned, enriched, and validated, it is safe to be pushed downstream and used for the analytical and modeling processes.
3. Why is Data Wrangling necessary?
Given the current state of data, the need of data wrangling is quite crucial. As it is often impossible to use the data in the raw form for any analytical purposes. Thus, the data wrangling steps mentioned above are almost mandatory. Data wrangling fundamentally changes the data-
– Firstly, it makes the data structured to be easily manipulated, mined, analyzed, etc.
– Secondly, it reduces the noise found in the data as it can badly affect the analysis
– Thirdly, it brings up the underlying or subdued information, which enhances the knowledge gained from the dataset
Lastly, by going through all the data wrangling steps, the user gets a better sense of the nature of the data they are dealing with. This can aid them in the analytical and predictive stages.
4. Data Wrangling Tools and Techniques
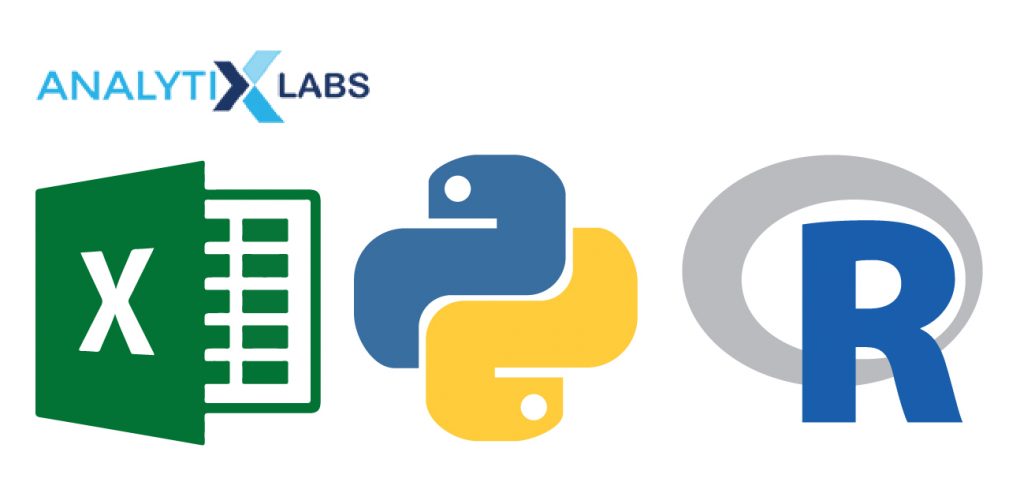
There are several data wrangling techniques and tools to increase efficiency. The user must be proficient in whichever tool they use, as most of the time (~70%-80%) goes into data wrangling, requiring a decent skill. Below, we have summarized some of the most common tools and data wrangling examples for you-
- Python
Data wrangling in Python is easy to perform if one knows some basic Python libraries. Thus, one of the most popular languages, Python, is also a data wrangling tool. There are several data wrangling techniques in Python to enhance performance. For example:
-Pandas or Pyspark to access the data
-Tabula, pandas, and nltk to convert it into a structured format
-csvkit, plotly to understand the data
-NumPy or pandas or cleaning and enriching the data
You may also like to read: 10 Steps to Mastering Python for Data Science | For Beginners
- R
R is a statistical tool that we use to perform data wrangling. It has many libraries that can help achieve the various Data Wrangling steps. This makes it a good candidate for a Data Wrangling tool. A technique can be of
-dplyr to access the data
-dplyr, reshape2 to convert it into a structured format
-hmisc, dplyr, ggplot2, plotly to understand the data
-purr, dplyr, and splitsstackshape to clean the data
- Excel
Excel is a very popular and easy-to-use software to perform data wrangling functions. There are hundreds of formulae in Excel to increase efficiency. However, this is a much more manual process, unlike R and Python. This is so because all the data wrangling steps will be performed even for similar datasets. In contrast, in R or Python, a script can be written that can be made to rerun; of course, a way around this is by writing macros in Excel.
Apart from these significant tools, commercial suites such as Traficta, Altair, etc., perform automated data wrangling.
You may also like to read: 16 Best Big Data Tools And Their Key Features
5. How Machine Learning can help in Data Wrangling
The idea of machine learning always has boiled down to “rather than the user writing the code, the machine will write the code for you.” This has led to many changes in which we work. Like increased speed, accuracy, efficiency, and reduction in the resource required to perform a task.
We are currently exploiting Machine Learning for the latter half of the data science process, i.e., data analytics and predictive modeling. However, the most time-consuming step lies before that – data wrangling. This is where Machine Learning comes to use. As mentioned above, there are some automated data-wrangling tools, but there is a need for more.
In this regard, Machine Learning processes work. Such as creating machine learning models that work in a supervised learning setup to combine multiple data sources and making them in a structured format. Models working in an unsupervised learning setup are helpful in understanding the data.
To look for certain predefined patterns present in the data, we can also create classification models. We can automate the Data Wrangling process using a combination of all these models.
You may also like to read: Machine Learning Vs. Data Mining Vs. Pattern Recognition
6. FAQs – Frequently Asked Questions
Q1. What are the challenges in data wrangling?
Data wrangling is a dynamic process requiring subjective decisions at the user end, making it difficult to automate. Thus, the challenges in data wrangling include difficulty identifying the appropriate steps, a significant amount of time consumed in the processes, etc.
Q2. What are the benefits of data wrangling?
A good data wrangling process can provide data analysts and scientists with quality data. This, in turn, can lead to better insights and predictions.
Q3. What are the essential skills for data wrangling?
It is very important to have a good command over data manipulation using Python or R to use them as a data wrangling tool. One can also use small datasets, like Excel or similar spreadsheet software. Having a good understanding of the business helps immensely. It helps make a more informed decision when performing data wrangling.
7. Concluding Thoughts
Data Wrangling is a crucial step in a data science project cycle that is often overlooked and less talked about. Many well-built and well-defined tools for all the other processes can automate the task. Data wrangling processes remain manual, and users must use their understanding of data to make them usable.
For anyone dealing with data, be it any vertical in an organization, having a sense of data wrangling and its processes is essential. The efficiency of analysis and predictions is based on the level of excellence one has achieved in Data Wrangling.
Want to learn Data Wrangling and many other practical machine learning skills?
Check out our Python Machine Learning Course now!
You may also like to read:
1. What Are the Important Topics in Machine Learning?
2. Data Mining Techniques, Concepts, and Its Application
3. What Is Data Preprocessing in Machine Learning | Examples and Codes

