Data science has become indispensable amidst the abundant information and data available today. As data-driven decision-making becomes increasingly important, businesses constantly search for skilled data scientists with the right tools to tackle complex problems and extract valuable insights from large datasets.
According to McKinsey, there might be a shortage of up to 250,000 data scientists in the United States alone by 2024.
Data science tools are the backbone of any data science project. These tools help with tasks like gathering, handling, transforming, analyzing, and visualizing datasets, simplifying complex processes. They allow data scientists to focus on finding insights by uncovering patterns that might not be apparent initially.
For more detailed industry insights: Data Science Bible Report 2023
Before we discuss these essential data science tools, important note ⬇️
Explore our signature Data Science and Analytics courses that cover the most important industry-relevant tools and prepare you for real-time challenges. Enroll and take a step towards transforming your career today. We also have comprehensive and industry-relevant courses in machine learning, AI engineering, and Deep Learning. Explore our wide range of courses. P.S. Check out our upcoming batches or book a free demo with us. Also, check out our exclusive enrollment offers
Let’s get started.
List of Top Data Science Tools
Data science tools are critical in enhancing workflows by simplifying complex tasks, facilitating data processing and analysis, and ensuring accurate and reliable results.
- Data Collection and Storage tools
- Data Cleaning and Preprocessing tools
- Exploratory Data Analysis tools
- Machine Learning tools
- Big Data Processing tools
- Version Control tools
Let us take an in-depth look at the essential tools for data science professionals:
Data Collection and Storage Tools
Data collection and storage involves collecting, storing, cleaning, and preprocessing the data. These data scientist tools assist in transforming and manipulating raw data into a suitable format for further analysis.
Web Scraping
Web Scraping is a technique used to gather data unavailable through traditional methods. It involves using automated techniques or bots to gather large amounts of data from different websites for various reasons, such as price comparison, market research, and content aggregation.
These tools used in data science eliminate the tedious task of manually copying and pasting information from web pages.
1) Scrapy
Scrapy is a powerful open-source web crawling framework in Python. Its primary purpose is collecting data from websites and storing it in a structured way.
Scrapy offers a range of features that make web scraping efficient and flexible. It provides a user-friendly way to define the data you want to extract using XPath or CSS selectors.
With built-in request support, Scrapy can navigate complex websites and handle various data formats. It also supports asynchronous processing, allowing for concurrent data extraction. Overall, Scrapy is an essential tool for collecting web data in a structured and organized manner for data science projects.
2) Beautiful Soup
Beautiful Soup is a Python library. It is used for web scraping and parsing HTML and XML documents. Beautiful Soup simplifies the process of extracting data from websites by creating a parse tree from the source code of a web page. Data scientists use it to navigate the document and search for specific elements using Python code.
Beautiful Soup is particularly useful for tasks that involve gathering data from websites for analysis. Its versatility and user-friendly approach make it an indispensable tool for extracting structured data from web pages.
Data scientists rely on Beautiful Soup to efficiently collect and preprocess web data, a crucial step in many data science projects.
APIs
Application Programming Interfaces connect different software systems and allow for the exchange of information between them. They provide a structured way of accessing data from various sources.
3) Google Maps API
The Google Maps API comprises a collection of application programming interfaces (APIs) offered by Google, designed to integrate mapping and location-based services into various applications. It provides access to a wealth of geographic data, including maps, location information, and place details.
Data scientists utilize the Google Maps API to incorporate geographic data into their analyses, visualizations, and applications. The tool simplifies mapping and geospatial analysis tasks, making it easier to work with location-based data.
4) Facebook Graph API
The Facebook Graph API offers programmatic access to Facebook’s vast social graph, enabling data scientists and developers to retrieve and analyze data from the social media platform. It gives access to a wide range of information, including user profiles, posts, photos, interactions, and more.
Data scientists leverage the Facebook Graph API to gain insights into user behavior, track social media trends, and understand the dynamics of online communities.
It is a valuable resource for extracting and analyzing data from one of the world’s largest social networks. It enables researchers to study and make data-driven decisions based on Facebook’s rich data ecosystem.
Data Storage
Once data has been collected, it must be stored in a suitable format for further processing and analysis. Different databases, such as relational, NoSQL, or cloud-based storage, can be used depending on the data type and requirements.
5) MySQL and PostgreSQL
MySQL and PostgreSQL are open-source relational database management systems (RDBMS) used extensively by data scientists.
MySQL and PostgreSQL, renowned for speed and ease of use, are preferred by data scientists for managing and analyzing structured datasets. These reliable databases offer robust data management capabilities, including support for SQL queries, transactions, and data integrity constraints. They are essential data storage, manipulation, and retrieval tools in science projects.
Also read: Guide to master SQL for Data Science
6) MongoDB and Cassandra
MongoDB and Cassandra are popular NoSQL database management systems highly valued by data scientists for managing unstructured and semi-structured data. MongoDB, known for its document-oriented design, stores data in flexible, JSON-like documents, offering scalability and ease of use.
On the other hand, Apache Cassandra is a distributed database optimized for scalability, fault tolerance, and real-time data processing.
Data scientists turn to MongoDB and Cassandra when dealing with vast and diverse datasets, requiring flexible, scalable, and high-performance storage solutions.
These NoSQL databases empower data scientists to work with data efficiently that does not fit traditional relational database models, making them essential tools for big data and real-time analytics.
7)Amazon S3 and Google Cloud Storage
Amazon S3 (Simple Storage Service) and Google Cloud Storage are cloud-based storage services highly favored by data scientists.
They provide secure and scalable cloud storage solutions. Amazon S3 and Google Cloud Storage offer easy-to-use object storage features like versioning and data lifecycle management. Data scientists use these services for storing and managing large datasets, ensuring accessibility and durability for various cloud-based projects.
Data Cleaning and Preprocessing
Before any meaningful analysis can take place, raw data needs to be cleaned and preprocessed to ensure accuracy and reliability. It involves identifying and correcting errors, removing irrelevant or inaccurate data, handling missing values, and removing outliers in a dataset.
Data Wrangling
Data wrangling involves cleaning and structuring raw data into a usable format for analysis. It may include merging datasets, reshaping data, and transforming variables.
Also read: What is Data Wrangling?
8) Pandas
Pandas is a highly popular and indispensable Python library for data manipulation and analysis. It provides data structures and functions tailored to efficiently handle structured data, including tables, time series, etc.
Data scientists turn to Pandas for data cleaning, transformation, filtering, and aggregation tasks. It simplifies working with datasets, making preparing data for analysis or visualization easier. Pandas are a widely used tool in various industries, from healthcare to finance, because of their flexibility and user-friendly nature.
9) Dplyr
Dplyr is a powerful R package focusing on data manipulation and transformation. Designed to streamline and simplify the data-wrangling process, Dplyr offers a set of intuitive functions for tasks such as filtering, grouping, summarizing, and reshaping data.
Data scientists frequently rely on Dplyr when working with datasets in R, as it allows them to manipulate and process data efficiently. Dplyr’s user-friendly syntax makes extracting meaningful insights from data easier, facilitating data preparation for analysis and visualization.
Data Cleaning
The process of identifying and rectifying errors and inconsistencies in the data is known as Data Cleaning. It involves removing duplicate records, correcting spelling mistakes, and handling missing data.
Also read: How to Minimize Dirty Data?
10) OpenRefine
OpenRefine, previously known as Google Refine, is an open-source data cleaning and transformation tool.
OpenRefine is invaluable for data scientists dealing with messy or unstructured datasets. It simplifies the standardization and preparation of data for analysis through a user-friendly interface. Widely used for tasks like deduplication, text standardization, and data normalization, OpenRefine enhances data quality, making it a crucial tool in the data science toolkit.
11) Talend
Talend is a powerful open-source data integration and ETL (Extract, Transform, Load) tool that data scientists often rely on. This versatile tool simplifies data processing by enabling users to extract data from different sources, turn it into the desired format, and load it into a target database or data warehouse.
Talend’s user-friendly interface makes it accessible to diverse technical users, streamlining complex data integration workflows. Widely used in tasks like data migration and transformation, it efficiently manages data from multiple sources, making it an essential tool in the data science toolbox.
Also read: Data Warehouse Interview QnA
Text Preprocessing
Data that includes text requires additional preprocessing techniques such as tokenization, stemming, and lemmatization to make it suitable for analysis. These techniques help standardize text data and make it easier to analyze.
12) NLTK
The Natural Language Toolkit (NLTK) is a comprehensive Python library designed for working with human language data, making it an indispensable tool for natural language processing (NLP) in data science.
NLTK offers various resources, including text corpora, lexical tools, and text-processing libraries, making it indispensable for tasks like tokenization, stemming, and part-of-speech tagging.
Data scientists and linguists rely on NLTK for advanced NLP tasks such as named entity recognition and sentiment analysis. Its extensive collection of algorithms and datasets enables researchers to effortlessly explore, analyze, and derive insights from textual data.
13) SpaCy
SpaCy, a popular Python library for natural language processing (NLP), is widely chosen by data scientists for its exceptional speed and efficiency. It supports tasks such as named entity recognition, part-of-speech tagging, dependency parsing, and text classification.
SpaCy’s user-friendly interface and pre-trained models streamline NLP tasks, making it a valuable tool for efficient text analysis in data science projects.
Its capabilities empower data scientists to extract information from unstructured text and perform complex language processing, contributing to the success of NLP applications and analysis.
Exploratory Data Analysis (EDA)
EDA involves analyzing and visualizing data to gain insights and understand patterns in the data. It allows the identification of trends, relationships, and anomalies in the data.
Data Visualization
Data visualization is a powerful tool used in EDA to represent data visually through charts, graphs, and other graphical methods. It allows for easy interpretation and communication of complex data.
Also read: How Data Compression Technique helps in Data Representation?
14) Matplotlib
Matplotlib, a versatile Python library, is crucial for creating data visualizations. Data scientists use it to generate charts and plots to communicate insights effectively.
Its flexibility allows the creation of static, animated, and interactive visualizations, making it essential for data presentation. Well-suited for tasks from basic charts to complex 3D visualizations, Matplotlib offers extensive customization options, empowering data scientists to tailor visualizations for compelling data representations in various projects.
15) Tableau
Tableau, a robust tool, is favored by data scientists for creating interactive and shareable data dashboards. It simplifies the exploration and presentation of data, connecting to various sources.
Data scientists use Tableau to generate diverse visualizations, including charts, graphs, maps, and interactive dashboards, facilitating trend identification and informed decision-making.
Its intuitive drag-and-drop interface and wide array of visualization options make Tableau a preferred choice for data scientists who seek to present data in a compelling and accessible manner.
16) Power BI
Power BI, created by Microsoft, is a powerful business analytics tool used extensively by data scientists and business professionals. It facilitates data visualization, sharing insights, and data-driven decision-making. Integrating seamlessly with diverse data sources, Power BI simplifies data analysis and reporting.
Data scientists leverage it to create interactive, informative data dashboards, explore data visually, and uncover patterns. Its user-friendly interface, pre-built templates, and natural language querying feature make it accessible to users with varying technical expertise.
Power BI supports data collaboration and offers cloud-based services, enabling real-time data updates. It is an essential tool for data scientists, enabling them to turn data into actionable insights.
Statistical Analysis
Statistical analysis involves various methods to uncover data patterns, trends, and relationships. It helps validate assumptions and make predictions based on the data.
Also read:
17) R
R is a popular and powerful programming language and environment for statistical analysis, data manipulation, and data visualization. Data scientists extensively utilize R for various data-related tasks. It offers various packages, libraries, and functions, making it a go-to choice for data manipulation, statistical modeling, and visualization.
R is particularly valuable for exploratory data analysis, hypothesis testing, and predictive modeling. It is versatile, accommodating various statistical techniques, and it has a vibrant community that regularly contributes new packages. With its flexibility and extensive ecosystem, R is a critical tool in the data scientist’s toolkit for tackling diverse data analysis challenges.
Also read: Benefits of Learning R Programming Language
18) SAS
SAS (Statistical Analysis System) is a comprehensive data science and analytics software suite. Data scientists use SAS for various tasks, including data management, advanced analytics, predictive modeling, and data exploration.
It offers a wealth of statistical procedures and data manipulation capabilities, making it a powerful tool for complex statistical analysis. SAS is particularly advantageous for industries that require rigorous data analysis, such as healthcare, finance, and research.
It supports data visualization, machine learning, and reporting, providing a complete analytics solution. Its versatility and extensive features make SAS a pivotal tool for data scientists tackling intricate data challenges and making data-driven decisions.
Also read: How to learn SAS : Certification, Skills, and Opportunities
Interactive Dashboards
Interactive dashboards provide a user-friendly interface to interact with visualizations and explore different aspects of the data. They allow for the creation of custom dashboards for data analysis and reporting.
19) Plotly
Plotly is a versatile Python library for creating interactive and dynamic data visualizations. Data scientists choose Plotly when the need for engaging, web-based charts and graphs arises in data exploration and presentation.
Plotly’s interactive features allow users to zoom, pan, and interact with visualizations, enhancing data understanding and engagement. It supports various chart types, including line plots, scatter plots, bar charts, and 3D visualizations.
Furthermore, Plotly easily integrates with other Python libraries and data analysis tools. Its capability to generate visually appealing, interactive plots makes it one of the valuable tools required for data science projects for conveying data insights effectively and engaging their audience in the visualization process.
20) D3.js
D3.js, (Data-Driven Documents), is a powerful JavaScript library widely used for making interactive and dynamic data visualizations in web browsers. Data scientists and web developers opt for D3.js to build custom, interactive data visualizations tailored to specific project requirements.
D3.js utilizes web standards (HTML, SVG, and CSS) to bind data to the Document Object Model (DOM) and apply data-driven transformations.
D3.js offers flexibility for data scientists to craft a variety of engaging visualizations, from interactive charts to complex web applications. It is a crucial tool for delivering data insights and captivating audiences through interactive data storytelling.
Machine Learning
As a subset of Artificial Intelligence, Machine Learning (ML) involves learning models from data and making predictions and decisions without explicit programming. ML tools for data science include simple algorithms, such as decision trees, logistic regression, and K-nearest neighbors (KNN), and more complex techniques like artificial neural networks (ANN).
Also read:
Supervised Learning
21) Scikit-Learn
Scikit-Learn is an open-source ML library that supports supervised and unsupervised machine learning applications. It includes numerous algorithms and models called estimators. It provides functionality for model fitting, data preprocessing, transformation, selection, and evaluation.
Scikit-Learn primarily works on numeric data stored in SciPy sparse matrices or NumPy arrays. You can also execute tasks like data set loading and the creation of workflow pipelines with its library tools. However, it does not support deep learning and reinforcement learning due to certain limitations in design constraints.
22) Keras
Keras is an open-source deep learning API and framework that runs on top of TensorFlow. However, after its 2.4.0 release in June 2020, it was integrated into the platform.
It has a sequential interface that creates relatively simple linear stacks and functional API for building more complex graphs. The programming interface allows data scientists to access and use the TensorFlow machine learning platform.
Keras was designed to be a high-level API that drives rapid experimentation and requires less coding. The aim is to accelerate the implementation of machine learning models in deep learning neural networks with high iteration velocity.
23) TensorFlow
Its creators named TensorFlow after multidimensional arrays called Tensors. It is an open-source, dynamic toolkit renowned for its effectiveness and strong computational capabilities. It is now a common machine learning tool frequently used for complex ML algorithms like Deep Learning. The platform is compatible with CPUs, GPUs, and potent TPU platforms.
Unsupervised Learning
Unsupervised learning involves using unlabeled data to identify patterns and relationships in the data. Clustering and association rule mining are examples of unsupervised learning techniques.
24) NumPy
NumPy, or Numerical Python, is an open-source library in scientific computing, engineering, data science, and machine learning applications. It was created in 2006 by combining and modifying elements of two earlier libraries.
The library is a multidimensional array object collection that processes arrays to enable mathematical and logical functions. Due to its availability of numerous built-in functions, it is also considered one of the most useful libraries for Python.
25) Pandas
Pandas is an open-source Python library typically used for data analysis and manipulation. It features the two primary data structures – the Series and the Data Frame. The series is a one-dimensional array, and the Data Frame is a two-dimensional structure. These are used to manipulate data with integrated indexing.
Additionally, it provides features such as integrated handling of missing data, intelligent data alignment, data aggregation, and transformation. It also has built-in data visualization capabilities and data analysis functions. It can work with various file formats and languages, including CSV, SQL, HTML, and JSON.
Also read: Supervised vs. Unsupervised Learning in Machine Learning
Deep Learning
Deep learning is a machine learning subset that uses artificial neural networks to analyze complex and large datasets. It has shown great success in critical tasks such as image recognition and NLP.
26) PyTorch
PyTorch is widely used to build and train deep learning models-based neural networks. It encodes model inputs, outputs, and various parameters using array-like tensors. PyTorch offers C++ language that you can use as a separate front-end interface or to create extensions of Python applications.
Its library includes various functions and techniques, including a module for building neural networks, a torch server tool for deploying PyTorch models, and an automatic differentiation package called torch.autograd. It also provides enhanced flexibility and speed to ensure user adaptability.
Also read:
Big Data Processing
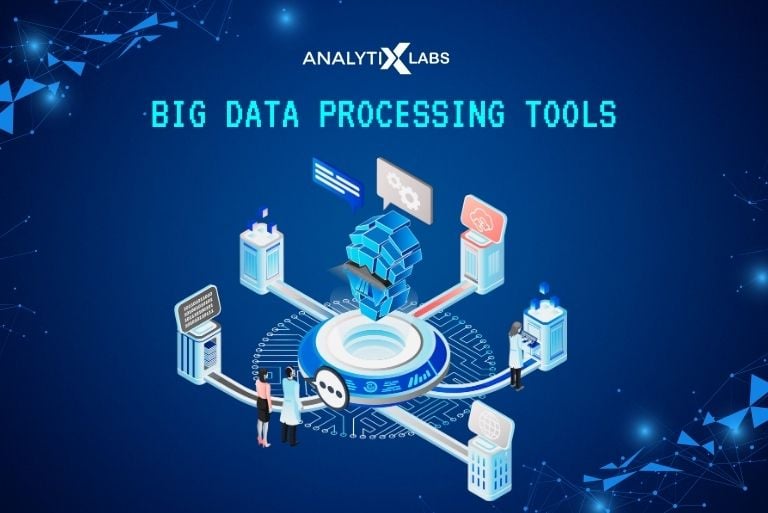
Big data refers to complex and large datasets that cannot be processed using traditional methods. It involves techniques such as distributed computing, parallel processing, and cloud-based solutions to handle these large datasets.
MapReduce
MapReduce is a programming model used for parallel processing of large datasets. It is commonly used in big data applications to distribute tasks across multiple nodes for faster and more efficient processing.
27) Hadoop
Hadoop is a framework that helps create programming models for large data volumes across multiple clusters of machines. Its low-cost storage feature helps data scientists in data storage and identifying data complexity. You can store anything from images and videos to texts without preprocessing.
Also read: Quick Guide to Hadoop: Benefits, Opportunities, and Career
28) Spark
Apache Spark is an effective tool to stream and process large amounts of data in a limited time. It uses the method of parallel processing on computer clusters. Spark works with many programming languages such as Java, Python, and R. Besides, it is scalable and has numerous libraries that allow you to manipulate data easily.
Stream Processing
Stream processing involves real-time analysis of continuous data streams. It enables data processing as it is generated, making it useful for real-time applications such as fraud detection and stock market analysis.
29) Apache Storm
Apache Storm is a distributed, open-source, real-time computation system for stream processing. It is highly scalable and fault-tolerant, making it suitable for handling large volumes of data in real time.
30) Kafka
Apache Kafka is an open-source stream processing platform for building real-time data pipelines and streaming applications. Kafka is designed to handle large volumes of data in real time, making it a popular choice for handling event streaming and data integration.
Cloud Computing
It involves using remote servers to manage, store, and process data over the Internet. It offers scalability, flexibility, and cost-effectiveness for data storage and processing.
Also read: A Quick Guide to Cloud Deployment
31) Amazon EMR
Elastic MapReduce (Amazon EMR) is an Amazon Web Services (AWS) cloud service. It processes and analyzes huge data volumes using the Hadoop and Spark frameworks.
EMR makes setting up, configuring, and managing clusters for huge data processing jobs simple. Scalability and integration with the big data ecosystem are among its main attributes. EMR makes it simple to scale your cluster up or down. It is compatible with numerous other data processing frameworks, including Hadoop, Spark, Hive, HBase, and Flink.
32) Google Cloud Dataflow
It is a managed stream and batch data processing service provided by Google Cloud Platform.
Designed for data transformation and processing tasks, it facilitates the real-time or batch processing, analysis, and transformation of data. Dataflow builds on Apache Beam, an open-source unified stream and batch data processing model.
33) Microsoft Azure HDInsight
Microsoft Azure HDInsight is a cloud-based big data and analytics platform provided by Microsoft Azure. It is designed to help organizations process, analyze, and derive insights from enormous volumes of data using open-source big data technologies.
HDInsight supports a range of popular open-source big data frameworks, including Apache Hadoop, Apache Spark, Apache Hive, Apache HBase, Apache Kafka, and more.
Version Control
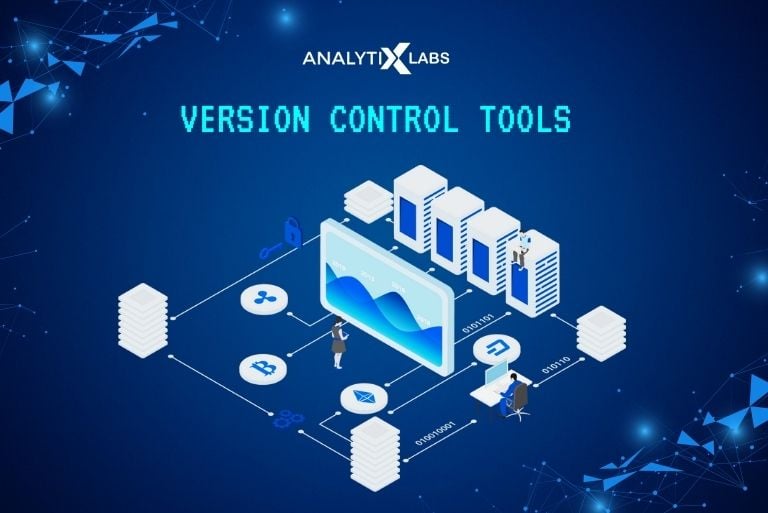
It is a system that tracks and manages changes made to a file or set of files. It allows for collaboration, efficient code management, and project history tracking.
34) Git
Git is the standard version control tool that allows a team to have multiple branches of the same project. Git allows each person to make changes, implementations, and developments so that the branch can merge seamlessly.
It is an essential data science tool for anyone working with programming languages for data analysis and data science. It is useful because those languages require you to share and access code with multiple users.
35) GitHub
GitHub allows you to create a seamless integration and delivery pipeline to test and deploy machine learning applications. You can also run automated processes, create alerts, and manipulate data using best DevOps practices.
The pipeline operates when a specific event occurs in your repository. You can also configure multiple pipelines to perform multiple tasks depending on your requirements. It is among the best tools used in data science for training models or analyzing data.
36) Jupyter Notebook
Jupyter Notebook is a web-based interface that runs everything, from simple data manipulation to complex data like science projects and research. It is also used for creative operations such as data visualization and documentation.
It supports Python, R, and the Julia programming language. You can also create text using markdown and LaTex to document. The results are displayed in HTML, LaTeX, and SVG.
With the help of Jupyter Notebook, you can run code directly in the browser or even separately. You can view the output of each code before executing the next code with a simple data science workflow.
How to Find the Right Data Science Tools
Finding the right data science tools is essential to succeed in any data-related project. Here are steps to help you make the right choice of the best tools of data science:
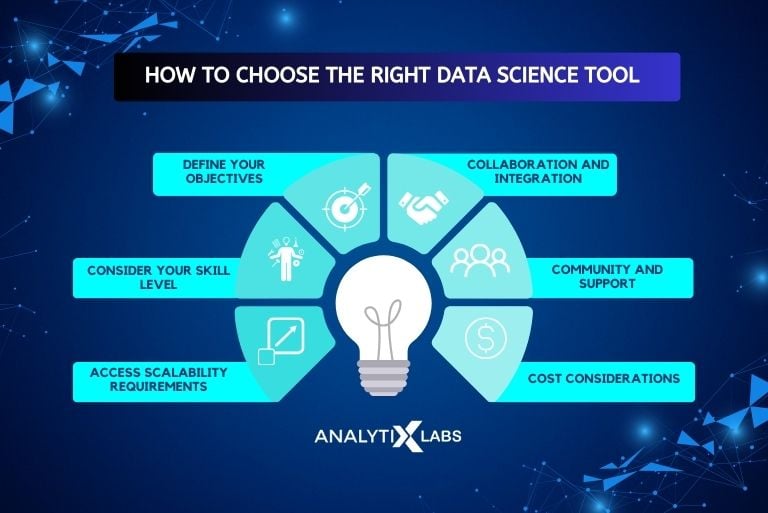
- Define Your Objectives: The initial step starts by thoroughly defining your data science objectives. Understand your aim and what type of data analysis or machine learning tasks are involved. Prepare a data science tools list accordingly.
- Consider Your Skill Level: Assess your and your team’s skill levels. Some tools in data science are more user-friendly for beginners, while others require more advanced knowledge. Choose data science software tools that match your proficiency. You must also be prepared to invest in training.
- Assess Scalability Requirements: Determine the scale of your data projects. Some tools used for data science are better suited for small-scale analysis, while others can handle big data. Consider your data volume and growth expectations to select data science tools and technologies that can scale as needed.
- Collaboration and Integration: Consider collaboration and integration with existing systems. Ensure the data science software you choose allows for collaboration among team members. It must seamlessly integrate with other software and databases you use in your organization.
- Community and Support: Evaluate the community and support available for the data science software tools you select. Open-source tools in data science often have active communities that provide resources and help. Consider the availability of documentation, forums, and support options for different data science tools.
- Cost Considerations: Budget constraints are essential for the success of your data science projects. Some tools used for data science are open-source and free, while others come with licensing fees or subscription costs. Be sure to account for the total cost of ownership, including software, hardware, and training of the data scientist tools you intend to use.
Conclusion
Data science has become essential in today’s data-driven landscape, and the demand for skilled professionals with the right tools is rising. The key to choosing the right tools lies in defining project objectives, considering skill levels, assessing scalability, ensuring collaboration and integration, evaluating community support, and accounting for costs.
This article gave a comprehensive overview of the diverse toolbox available to data scientists, empowering them to navigate data complexities and contribute to informed decision-making across industries.
Frequently Asked Questions
What are the four types of data science?
The four types of data analytics are diagnostic, descriptive, predictive, and prescriptive. These data types work together to enable organizations to understand their past, resolve issues, predict insights, and prescribe optimal actions.
Descriptive data type involves summarizing historical data to gain insights into past events or trends. At the same time, diagnostic data type identifies the factors and causes that led to specific outcomes.
Similarly, Predictive analytics uses historical data to build models to forecast future events or trends. Prescriptive analytics takes predictive analysis further by recommending actions to optimize outcomes.
Is Python a data science tool?
Yes, Python is a widely used and highly popular tool in data science. It is a versatile programming language and offers several libraries and frameworks, making it an excellent choice for data science. It is also a comprehensive ecosystem for data analysis, machine learning, and scientific computing. Its simplicity and robustness make it an ideal tool for data scientists to work with large datasets and perform various analytical tasks.
- Data Science Salary Report 2023
- PG In Data Science: Why You Should Opt for a PG Course?
- Computer Science vs Data Science
- How Data Science is Impacting Robotics
- Future Scope of Data Science: Career, Jobs, and Skills
- Data Science in Finance: A Detailed Guide to Get Started
- Understanding Predictive Analytics – Uses, Tools, and Techniques
- What is Data Strategy – Types, Components, Elements, and Importance



![Tree Traversal in Data Structure Using Python [with Codes] tree traversal in data structure](https://www.analytixlabs.co.in/blog/wp-content/uploads/2025/01/Cover-Image-1-370x245.jpg)


