Technical transformations have boomed in the last two decades. Before this, it seemed almost impossible to automate data analytics procedures. Fast-track to the present date, researchers and analysts can now develop procedures and techniques that can transform raw data into valuable insights. Machine learning and data science have aided in identifying patterns and uncovering new business opportunities. This article will teach you about data mining and its techniques for developing business insights.
What is Data Mining?
The massive input of data from different sources has brought up the need to organize, analyze, and extract the data to convert them into usable form. Data mining is a computer-assisted process of extracting valuable information and finding anomalies and correlations in data sets. It involves procedures, technologies, and analytical approaches to find insights in large data sets.
Data mining helps businesses with better decisions by integrating the routines from statistics, machine learning, and artificial intelligence. Encapsulating procedures conducting data collection, organization, analysis, visualization, and extraction, the phases of data mining can be classified under 6 steps:
- Setting organizational goals.
- Understanding the data.
- Preparing the data.
- Model building and pattern recognition.
- Evaluating the results.
- Knowledge implementation.
Why is Data Mining important for organizations?
Businesses today face tremendous competition in each sector. They need to stand out and reach their target audience to gain attention. Businesses can endeavor a competitive edge by developing insights from large data sets. Some major reasons to utilize data mining in your business operations are listed below.
- Data mining can help develop business intelligence by discovering relationships and patterns to understand customer behavior, buying trends, etc.
- It helps sift all the chaotic biases and unwanted noise in the data.
- It helps the stakeholders make important decisions corresponding to customer relationships, price optimization, risk analysis, competition, revenues, and operations.
- Data mining has been an integral part of organizations in this digital era. Effective implementation gives high returns to the business by generating precise predictions and finding hidden patterns in data.
- Data mining is also done to detect intrusions and find loopholes and bottlenecks in the operational procedures.
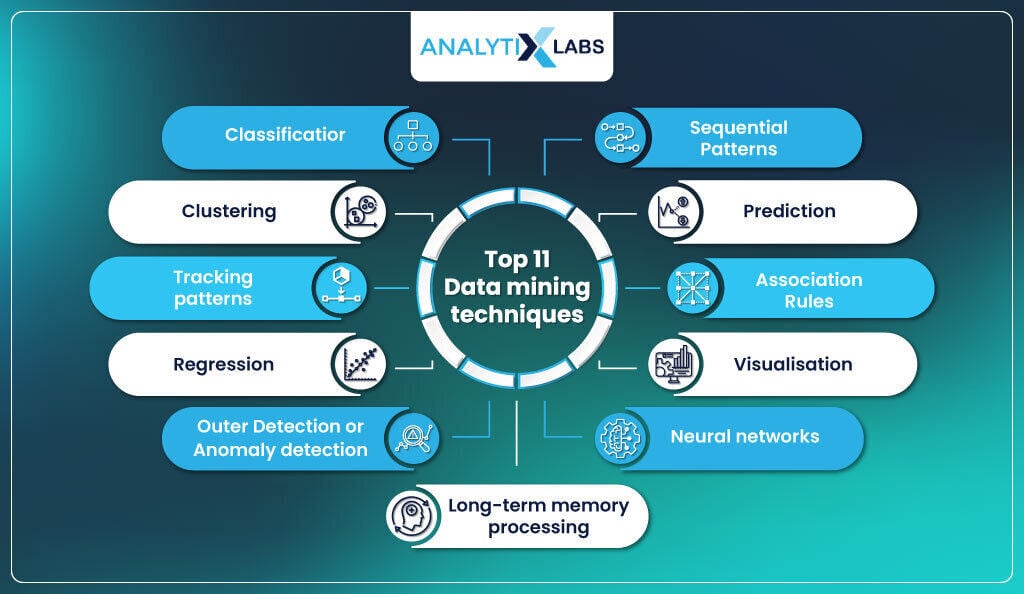
Top 11 Data mining techniques

Data mining involves procedures of applied mathematics and statistics along with data science algorithms to leverage the business with the power of knowledge. The businesses embed these procedures in accordance with the data availability. This section will help you understand powerful data mining techniques.
1. Classification
In general, classification means categorizing the available entities with respect to some target variable. Open your messy wardrobe; to clean and organize it, you would start separating the clothes based on ethnic, casual, formal, and loungewear.
Furthermore, the ones you do not fit into fall into the discarded category. Now in the data mining terms, all the clothes are the data recipient from multiple sources, the category for clothes analogies with the target class labels, and the discarded clothes are the outliers.
In order to provide a definition, we can term Classification as a predictive modeling technique within supervised learning. It involves predicting class labels based on a set of labeled observations. Businesses use this process of compartmentalization to draw essential inferences.
Also read: What is Classification Algorithm in Machine Learning?
2. Clustering
Clustering is a common technique used for grouping similar data. The only difference in classification and clustering is that the latter has no target variable. Clustering is the process of separating the data set into subgroups.
Recalling the previous wardrobe example, the clothes can be sub-grouped as tops and bottoms. The process of clustering is essential as it prepares the data for analysis. A major example of clustering is finding customers with similar purchasing behavior to generate interesting recommendations.
Also read: What is Clustering in Machine Learning?
3. Tracking patterns
A fundamental data mining technique, tracking patterns helps find hidden patterns and monitor trends in the data to build valuable insights. Pattern recognition is the most important data mining technique. It helps understand customer behavior, buying patterns, and people with similar interests. This knowledge discovery helps find potential customers, predict sales and much more for business proliferation.
4. Regression
Regression analysis is a technique within supervised learning. It involves training algorithms with input features and output labels to analyze the relation between independent and dependent variables. Plotting a best-fit line or a curve between the data is the ultimate aim of the applying regression algorithm.
Trained models, primarily a predictive modeling component, forecast the outputs of dynamic input data or bridge gaps in missing data. We evaluate regression models using three metrics: variance, bias, and error.
The types of regression are Linear regression, Multiple Linear Regression, Multivariate Linear Regression, Polynomial Regression, and Ridge and Lasso Regression.
5. Outer Detection or Anomaly detection
Outlier mining or outer detection, or anomaly detection, is a data mining technique used to identify the data items that do not match or fit in the expected behavior or predefined patterns. Discovering the outliers helps find the reasons behind their occurrence and prepare for future occurrences. Outer detection detects credit card fraud, network intrusions, and interruptions.
Also read: The Ultimate Guide to Anomaly Detection
6. Sequential Patterns
It is a data mining technique that discovers meaningful associations between the data occurrences. It helps find a time-ordered series of events occurring with a precise frequency to associate the dependency between them.
Sequential pattern mining is particularly useful in applying mining to transactional data for a specific period of time. Sequential Patterns has its use in stock market analysis, forecasting natural disasters, DNA sequencing research, and predicting possible attacks in cyber security.
7. Prediction
Prediction is a valuable data mining technique that combines different data mining techniques, including sequential patterns, classification, clustering, trends, etc. This data mining technique involves the use of historical data and events in sequence to understand the behavior and predict the occurrences of future events. One most used applications of prediction is evaluating the loss/profit for a business by understanding the sale.
8. Association Rules
Finding its grounds in statistics, the association rule is a data mining technique that finds relational patterns between the variables. This data mining technique follows the law of association, indicating the likelihood of occurrence of an event is dependent on the other data-driven events. For example, one is likely to buy car accessories from the market after buying a car.
9. Visualisation
Data visualization is a data mining technique granting people access to insights based on visual sensory perceptions. The dynamic visual patterns allow users to unveil the trends in the data to understand their business information.
10. Neural networks
Data mining techniques use artificial intelligence and deep learning to understand complex problems by functioning similarly to the human brain. Neural networks learn by example and build their own conclusions for certain sets of inputs based on previous data.
Also read: Fundamentals Concepts of Neural Networks & Deep Learning
11. Long-term memory processing
A data mining technique that drills out the large historical data stored in the data warehouses to analyze it over a longer time duration. It is majorly used in analyzing time-based information trends such as weather data.
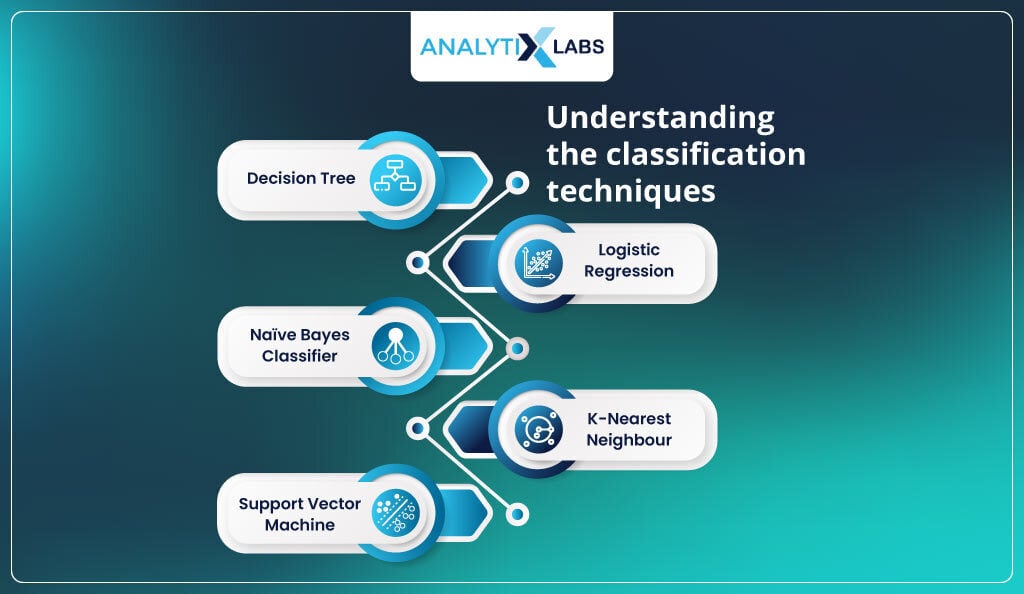
Understanding the classification techniques

1. Decision Tree
A supervised learning technique where the data is continually split depending upon specific parameters. It divides data by evaluating the input according to the given rules. Two attributes of the decision tree are the decision nodes and the leaves.
A decision tree classifier works well with classification problems (when the data can be classified on binary parameters) and regression problems (when the data is continuous).
Taking the root node as the initial point of the tree, the data is classified by predicting the suitable class label for each data entry until no further classification can be done. The types of decision tree are Categorical variable decision tree and Continuous variable decision tree.
Also read: Understanding Decision Tree Algorithm in Machine Learning
2. Logistic Regression
Logistic regression is used for data classification of too large datasets. The classifier utilizes a gradient descent approach to overcome some degree of optimum loss function variables with default risk. It uses statistical likelihood as the expected value of the dependent variable to decide the relationship between binary results and independent variables.
Logistic regression generates chances dependent on the regressor values of an existing condition. The probabilities can be transformed into a probability for categorizing findings. A probability is allocated for each transaction checked that is then used to identify the transaction as fraudulent or non-fraudulent.
If the probability meets the threshold, it is fraudulent; otherwise, it is not fraudulent.
Also read: Logistic Regression in R
3. Naïve Bayes Classifier
A powerful and regularly utilized AI classifier, Naïve Bayes, is based on Bayesian Classification. It is a supervised learning technique approach that involves procedures from statistical techniques for classification. A Naive Bayes classifier is a basic probabilistic classifier based on the Bayes Theorem with naïve independence assumptions.
This classifier assumes that the existence or lack of a class feature is not associated with any other class feature. Bayes theorem calculates the posterior probability, P(c|x), from P(c), P(x), P(x|c). According to Naive Bayes, the impact of a predictor (x) value on a given class (c) is regardless of other predictors’ values. This hypothesis is known as class conditional independence.
The Bayes rule provided below is the foundation for all Bayesian learning methods.
- P(c|x) represents the posterior probability of a class (target) given a predictor (attribute).
- P(c) stands for the prior probability of the class.
- P(x|c) denotes the likelihood, which signifies the probability of the predictor given the class.
- P(x) is the prior probability of the predictor.
4. K-Nearest Neighbour
Cover and Hart put forward the K Nearest Neighbour algorithm in 1968. The classifier is an iterative clustering algorithm that partitions the given data set into K clusters where the user selects K. Following iterative regression; it locates an ideal situation for K centers such that the total of all distances is the least.
It is a supervised learning technique. K-NN is a non-parametric classification method, as it makes no assumptions about data transfer or data distribution. The benefits of K-NN are high precision, insensitivity to outliers, and no assumption of information.
Also read: KNN Algorithm in Machine Learning
5. Support Vector Machine
Support Vector Machine (SVM) is used to analyze classification or regression. SVM is a universal estimator of different data precision functions. It is an amazing machine learning method that can better examine the unknown predictability of different datasets. In the classification technique, input source data is changed to a high-dimensional feature space, in which the distinction is indicated to use a separate Hyperplane.
After separating the samples in the training data, the ideal Hyperplane positions itself between the two distinct Hyperplanes. The distance of the ideal Hyperplane is calculated based on the ideal margin, which positions it at the center between the two Hyperplanes. SVM categorizes primarily into linear SVM and nonlinear SVM, with maximum margin separators employed to enhance the classifier’s efficiency.
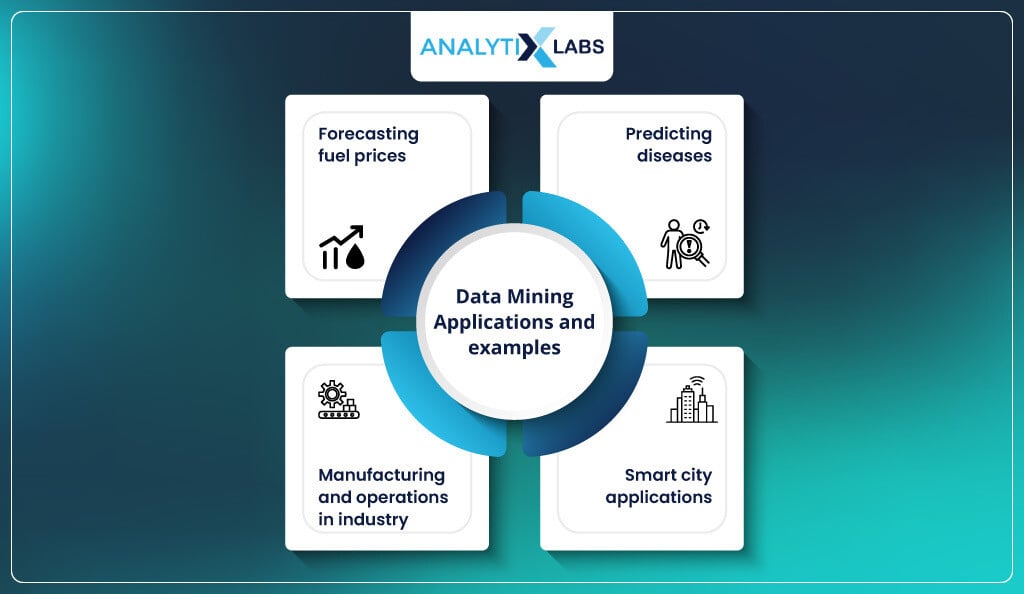
Data Mining Applications and Examples

The organizations receive multivariate data, which needs to be utilized as an asset. Data mining makes it possible to use messy data by converting them into usable form. The diversity and robustness of the data mining techniques have found their applications in various fields like banking, finance, manufacturing, sales, marketing, education, and customer relations. This section brings you the applications of data mining in the real world.
1. Forecasting fuel prices
Along with improving the mining techniques to dig out the oil and gas from the resources, it is necessary for the companies to work effectively to drill the volatile data from the energy market. Implementing data mining allows the companies to understand the plant equipment, operations, and procedures.
Additionally, forecasting usage trends can help in precise modeling, margin enhancement, and estimating plant throughput. Data mining has facilitated predictive maintenance procedures and has pulled off large upkeep costs, which leverages procurement decision-making.
2. Predicting diseases
The medical industry is information-rich but knowledge poor. Employing data mining techniques enables knowledge discovery from the massively available health data. Applying useful mining techniques to explore interesting patterns from a large group of disease datasets uses different techniques like clustering, prediction, classification, etc. This yields the extraction of constructive information and finds relationships among the disease attributes.
3. Manufacturing and operations in the industry
Manufacturing industries receive tremendous data inputs regularly. Embedding data mining techniques in procedures of production, operations, decision support, fault discovery, maintenance, and quality assurance can improve the functioning of the industry.
4. Smart city applications
The smart city projects collectively monitor traffic control systems, enterprise applications, smart healthcare, and more. To fulfill the objective, we use multiple sensors, IoT-based devices, and Edge devices, contributing to the data volume in the data center.
The data from interactive interconnected devices permits dynamic data mining for sensors. Techniques like classification and time series analysis models can categorize dynamic data. We store data from smart devices and their corresponding time periods to apply linear regression to predict future events.
Conclusion
Data mining techniques continually evolve to be powerful, cost-efficient, and easy to apply. Organizations in all industrial sectors leverage these techniques to generate valuable business insights and achieve high profits. Intensified data sources open up more potential for future data mining techniques to evolve.
FAQs
- What are data mining classification techniques?
The major data mining classification techniques include classification, clustering, anomaly detection, regression, association rule learning, sequential patterns, and prediction.
- What is a classification example?
Grouping the data entities based on similarity or class labels. For example Class of fruits, Class of amphibians.
- What is the most popular data mining technique?
Classification, clustering, and regression are the most used data mining techniques.
- How data reduction increases data mining efficiency?
- Machine Learning vs. Pattern Recognition vs. Data Mining
- Top Machine Learning Trends 2023
- What is Distribution in Statistics?
- Activation Functions In Neural Networks – Its Components, Uses & Types
- Machine Learning vs. Deep Learning: Similarities and Differences


