Data, as we know, is available to us in the raw form of information. The raw piece of information has a journey of its own before it converts into insightful data. These chunks of information can be hard to understand in their crude form and cannot be directly fed into the algorithms. It goes through a series of steps.
The two most important steps in this ladder are Data Analysis and Data Interpretation. Some of us may have thought these terms are synonyms of each other. It is not so. These two are entirely different processes and also follow a chronology in the life cycle of data science.
In this article, we shall explore data analysis, data interpretation, the types of data analysis, what methods are available for data interpretation, and why data analysis and interpretation are essential.
AnalytixLabs, a training solutions and capacity-building firm, is India’s top-ranked Artificial Intelligence & Data Science Institute. Offering a wide range of data analytics courses, including detailed project work that enables individuals to be fit for professional roles in AI, Data Science, and Data Engineering. With its decade of experience providing meticulous, practical, and tailored learning, AnalytixLabs is proficient in making aspirants “industry-ready” professionals.
What is Data Analysis?
Data analysis is described “as the process of bringing order, structure, and meaning” to the collected data. The data analysis aims to unearth patterns or regularities by observing, exploring, organizing, transforming, and modeling the collected data.
It is a systematic approach to applying statistical techniques for describing, exhibiting, and evaluating the data. It helps drive meaningful insights, form conclusions, and support the decision-making process. This process of converting data, ordering, and summarizing it also gets answers to questions to test if the hypothesis holds. Exploratory data analysis is a huge part of data analysis. It is to understand and discover the relationships between the variables in the data.
There are several data analysis tools available. Some of those are:
- Python
- R
- SAS
- Apache Spark
- Tableau
- Power BI
- QlikView
- Microsoft Excel
- KNIME
- RapidMiner
- Solver
- OpenRefine
- NodeXL
- io
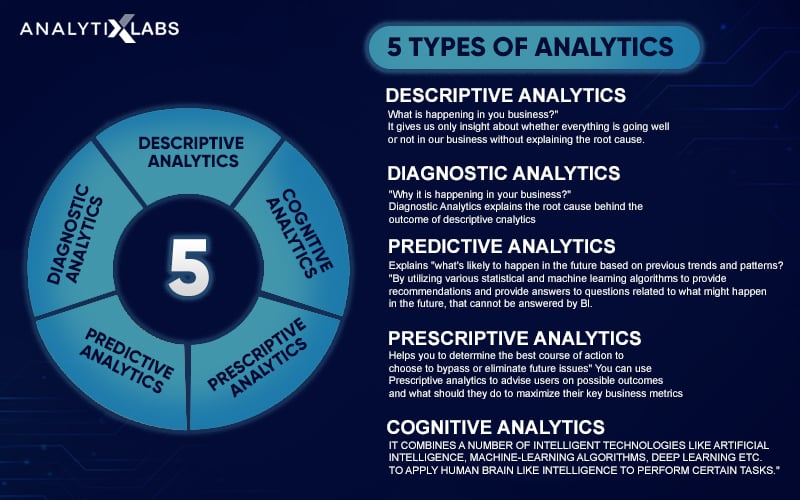
There are five types of data analysis:
- Descriptive Analysis
- Diagnostic Analysis
- Predictive Analysis
- Prescriptive Analysis
- Cognitive Analysis

1. Descriptive Analysis: What has happened?
Descriptive Analysis, as the name says, describes the data. The foundation step simply looks at the past data and tells what has happened in the past. It captures and summarizes the past using measures of central tendency, measures of dispersion, visualizing using dashboards. This analysis helps understand how the data is present and does not make any predictions or answers why something has happened. It is useful for generating reports, tracking Key Performance Indicators (KPIs), sales leads, and revenue reports.
2. Diagnostic Analysis: Why has it happened?
After identifying what has happened, the next logical step in the process is to find the answer to why something has happened. Diagnostic analysis helps dig further by creating detailed, informative, dynamic, and interactive dashboards to answer that. It separates the root cause of the problem and identifies the source of the patterns. It is also useful in anomaly detection. And the factors that affect the business. It can be applied to determine which factors led to improvement in sales.
3. Predictive Analysis: What is likely to happen?
After detecting the root cause of the problem and understanding the causal relationship between the variables, one would want to know if the event is likely to happen again? Predictive analysis is all about that. It predicts the likelihood of an event, forecasting any measurable amount, risk assessment, and segmenting customers into groups. Since it forecasts the occurrence of an event, it employs probability. Along with the previous summarized and root cause analysis, the models use statistics and machine learning algorithms for predicting future outcomes.
4. Prescriptive Analysis: How to make it happen?
The prescriptive analysis is result-oriented. It collaborates the learnings from the what, why has happened with what is likely to happen to help with what measures to maximize the primary business metrics. It prescribes the best course of action, strategies. The prescriptive analysis is not predicting one individual standalone event but a collection of future events using simulation and optimization. It is heavily applied in the financial, social media, marketing, and transportation domains. Its uses are varied from recommending products or movies to suggesting which strategies to use to reap maximum returns and minimize risk.
5. Cognitive Analysis: Mimicking the human brain to carry out tasks
This advanced type of analysis aims to mimic a human brain to perform tasks like a human does. It combines technologies such as artificial intelligence, semantics, machine learning, and deep learning algorithms. It learns and even generates data using the already available data and retrieves features and hidden patterns. Real-time data cognitive analysis is heavily employed in image classification and segmentation, detection of objects, machine translations, virtual assistants, and chatbots.
What is Data Interpretation?
Once the data has been analyzed, the next progressive step is to interpret the data.
Data interpretation is the process of assigning meaning to the processed and analyzed data. It enables us to make informed and meaningful conclusions, implications, infer the significance between the relationships of variables and explain the patterns in the data.
Explaining numerical data points and categorical data points would require different methods; hence, the different nature of data demands different data interpretation techniques.
There are two primary techniques available to understand and interpret the data:
- Quantitative, and
- Qualitative

Quantitative Methods
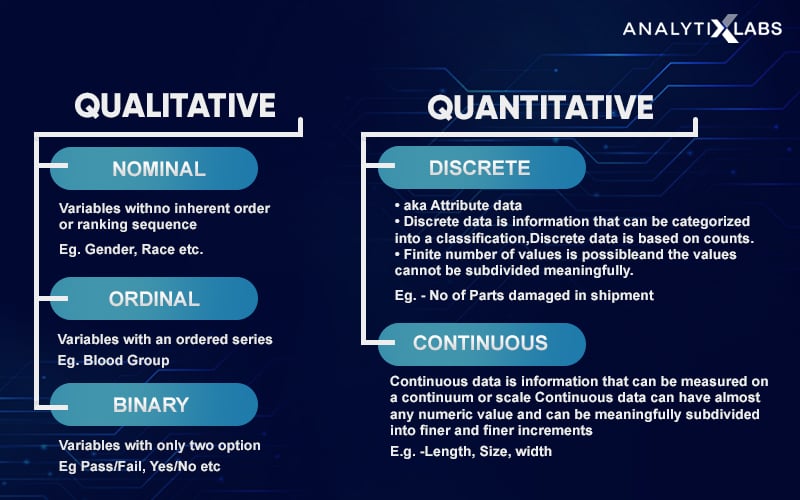
The quantitative data interpretation technique is applicable for the measurable or numerical type of data. The numerical data is of two types:
- Discrete: countable, finite quantities. Eg: the number of ice-creams
- Continuous: not countable. Eg: height, weight, time, speed, humidity, temperature
The numerical data is relatively easier to analyze using the statistical modeling methods, including central tendency and dispersion measures. These can be visually depicted via charts such as bar graphs, pie-chart, line graphs, line charts. Tables are also used in representing complex information dissecting into categories.
There are two most commonly used quantitative data analysis methods are:
- Descriptive Statistics: this field of statistics focuses on describing the data, its features. It comprises of two categories: measures of central tendency (mean, median, mode, and measures of dispersion or variability, which tell how much spread is there in the data or the data varies.
- Inferential Statistics: this branch of statistics generalizes or infers how the larger data is, its features based on the sample taken from this larger data.
Qualitative Methods
Qualitative methods are implemented to analyze the textual and the descriptive data called the categorical data. Text data is usually unstructured. The qualitative data is subdivided further based on their characteristics:
- Nominal: The attributes have no ranking or order. Eg: Region, Gender, Classes in school
- Ordinal: The attributes are ranked or ordered in a sequence. Eg: Grades
- Binary: It has only two categories. Either yes or no, Class 1 or 0.
Unlike numerical data, categorical data cannot be directly analyzed as the data here is non-statistical, and also, the machines understand only the language of the numbers.
So, the text data is first coded and converted into numerical data. There are different coding approaches available based on the requirement. The text data is categorized into labels to be used for modeling and interpretation.
For a detailed comparison between the two methods of data interpretation, refer to this blog on How to Understand the Quantitative and Qualitative Data in Your Business.
Importance of Data Analysis and Interpretation
Data analysis aims to bring order and structure to data by manipulating, summarizing, and reducing it to an interpretable form. It helps to uncover the patterns in the data. Data interpretation aims to execute and apply processes that assign meaning to these discovered patterns by analyzing data. It draws statistical conclusions, infers the relationships and implications.
For instance, the business objective of the retailer is to recommend products to customers based on the past data it has collected. We start understanding the characteristics of the current and former customers. This is data analysis as it only states how the data is. Once we start examining and postulating the customers based on their similar characteristics, that is data interpretation. This is where assumptions are made, such as customers who buy X brand’s products also tend to buy products from another similar brand. Here, we are thinking beyond the data and seeing the underlying reasoning behind the data about the real implications.
Following are the reasons why the data analysis and interpretation are important:
1. Informed decision-making:
Data analysis and interpretation are instrumental in making informed decisions, relying on data, applying methodical analysis techniques, and not intuition or guessing. This requires a very systematic and structured data collection process to be implemented.
2. Identification of trend and forecasting needs:
Data analysis offers insights that can predict and set trends that can positively impact an industry level. When a lot of people started viewing web series and movies on online platforms. The producers started making, releasing more OTT content, and this trend picked up and has changed the dynamics of the entertainment industry.
3. Cost-efficient:
One of the most important goals for any business apart from maximum returns is to reduce costs. Data-driven informed decisions not only help in improving business metrics but also in reducing costs, which is another avenue of generating revenue. Predictive data analytics helps achieve this objective by using response modeling, uplift response modeling, churn modeling, churn uplift modeling, risk modeling, and fraud detection.
4. Clear Insights:
These processes allow organizations to get foresight in their performance and processes. It enables the companies to know how customers view them and their limitations and take actionable measures to improve their performance.
You may also like to read: What is Data Analytics? Career Guide – Analytics Stages, Skills & Jobs
What is the difference between Data Analysis and Interpretation?
Data analysis and interpretation transform the collected data into story points to drive insights. There are differences between the two processes, which follows as:
| Data Analysis | Data Interpretation | |
|---|---|---|
| Meaning | Data analysis is the process of uncovering patterns and trends in the data. | Data interpretation is the process of assigning meaning to the data. It involves explaining those discovered patterns and trends in the data. |
| Chronology | Data analysis comes first, followed by data interpretation. | Data interpretation is the next proceeding step after data analysis. |
| Types/Methods | The five types of data analysis are Descriptive Analysis, Diagnostic Analysis, Predictive Analysis, Prescriptive Analysis, and Cognitive Analysis. | The data interpretation methods are Quantitative Methods and Qualitative Methods. |
| Why is it needed? | To summarize, condense data in a comprehensible and usable form for further advanced analytics and prediction. | Data interpretation is required because the numbers can not speak for themselves. It needs manual human intervention to understand what the numbers are saying. |
| Example | For example, the top 5 teams in terms of the winning Percentages are Real Madrid, Barcelona, Atletico Madrid, Valencia, and Athletic Bilbao. | An example of interpretation is what does it imply 95% of the population lies within the range of 136.54 to 143.45. |
FAQs – Fequently Asked Questions
Ques 1. What are the two most commonly used quantitative data analysis methods?
Ans. The two most commonly used quantitative data analysis methods are:
- Descriptive Statistics, and
- Inferential Statistics
You also like to learn about Basic Statistics Concepts for Data Science and Analytics
Ques 2. What are the 3 steps in interpreting data?
Ans. After assembling the required data, the three steps in interpreting data are:
- Develop the findings: The findings are the observations related to the data and summarizing the key aspects of the data. It builds to the second step of developing the conclusions.
- Develop conclusions: Conclusions help in reasoning and explain why the data is the way it is.
- Develop recommendations: Based upon the findings and conclusions we must form actionable result-oriented approaches and collect any further data that is needed.
Ques 3. Which comes first, analysis or interpretation?
Ans. The pecking order is analysis followed by the interpretation. The dictionary meaning of the word interprets “explain the meaning of (information or actions).” To explain the meaning of a dataset or graph or its nuances, we first need to analyze it; only then can we interpret it.
Ques 4. What are the techniques to analyze data?
Ans. The techniques available to analyze data are:
- Linear Regression
- Logistic Regression
- Cluster Analysis
- Variance Analysis
- Cohort Analysis
- Time Series Analysis
- Factor Analysis & PCA
- Sentiment Analysis
- Monte Carlo Simulation
- Support Vector Machines
Ques 5. What are the types of data analysis?
Ans. The types of data analysis are:
- Descriptive Analysis
- Diagnostic Analysis
- Predictive Analysis
- Prescriptive Analysis
- Cognitive Analysis
For more understanding, you may also refer to this blog: Different Types of Data and Business Analytics
Concluding Thoughts
Data is not only limited to business applications; our day-to-day life is filled with data from what time to get up (here, time is data), what to eat (the food item is another piece of information), in which stock to invest is all data. In each of these activities, we see what information is available, assess it, and then accordingly take decisions.
The only difference here is the scale and impact of those decisions. But the procedure of how we make those decisions remains the same. In this post, we unpacked the processes of what data analysis is, what data interpretation is, their respective types, how important these are to businesses, and the difference between data analysis and data interpretation. Feel free to drop your queries and thoughts in the comments section below.
To learn practical and career rewarding skills, explore our range of courses in Data Analysis! Our expert team will be happy to help you to understand your career prospects.
You may also like to read:
1. Difference Between Data And Information? Data Vs Information


2 Comments
This is a fantastic article that makes it easy to understand the basics of how to analyze data. Your FAQs section is great. I especially like the graphics, “5 Types of Analytics” and the “differences between Quantitative and Qualitative data interpretation.”
Thank you for linking to my article!
I found this document helpful to clarify the importance of the two and the differences. However on the types of data analysis, I was expecting for more clarity on whether all the types of data analysis can be used at once, or are they suitable for any particular data analysis?